
Advanced Excel formulas are important skills for professionals working in data operations, MIS reporting, business analysis, finance, HR operations, and back-office jobs. Companies use Microsoft Excel to manage records, clean datasets, match information, calculate performance, and prepare reports.
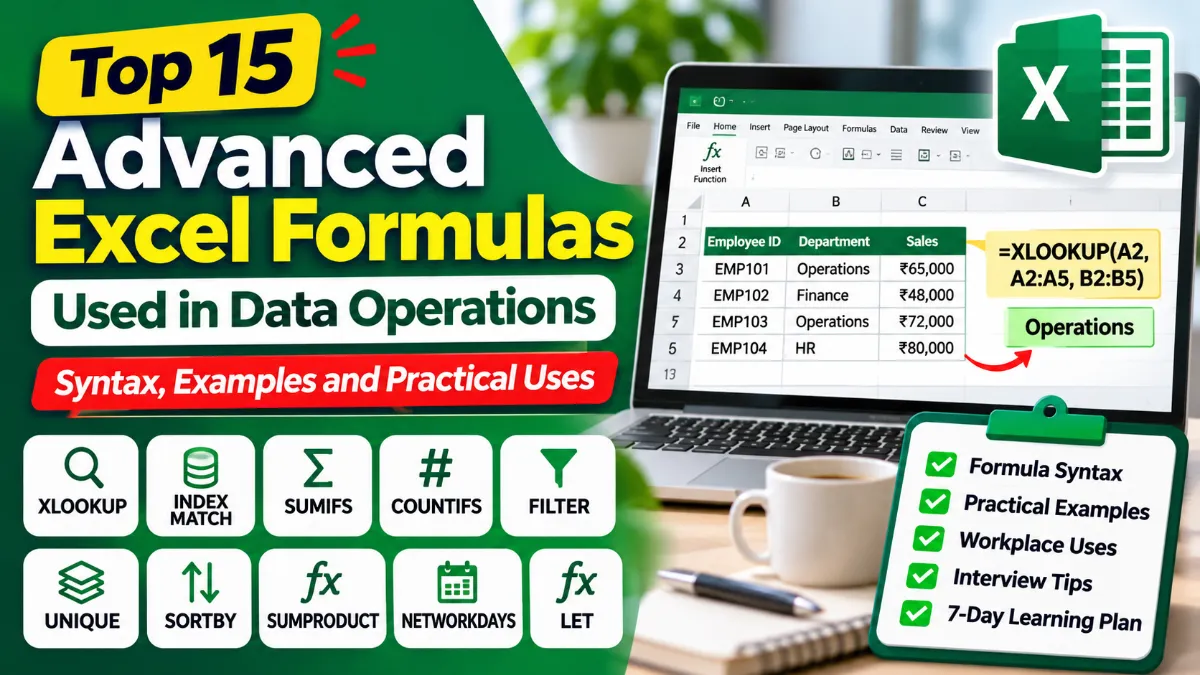
Basic Excel functions such as SUM, AVERAGE, and COUNT are useful for everyday calculations. However, data operations professionals often need advanced functions such as XLOOKUP, INDEX MATCH, SUMIFS, COUNTIFS, FILTER, IFERROR, SUMPRODUCT, and LET to handle more complicated tasks.
This article explains the top 15 advanced Excel formulas used in data operations, including their syntax, practical examples, common mistakes, and workplace applications. It also includes interview preparation tips and a seven-day learning plan for beginners.
Top 15 Advanced Excel Formulas – Quick Overview
The following table highlights important Excel functions and their practical applications.
| Excel Formula | Primary Use | Common Application |
|---|---|---|
| XLOOKUP | Find matching records | Employee and customer databases |
| INDEX + MATCH | Flexible data lookup | Data reconciliation |
| SUMIFS | Calculate conditional totals | Sales and finance reports |
| COUNTIFS | Count matching records | Task and attendance tracking |
| IF + AND + OR | Apply decision rules | Eligibility and performance checks |
| IFERROR | Handle formula errors | Reporting and data validation |
| FILTER | Extract matching records | Pending task reports |
| UNIQUE | Identify distinct values | Customer and employee records |
| SORT + SORTBY | Arrange data dynamically | Performance rankings |
| SUMPRODUCT | Perform array calculations | Inventory valuation |
| TEXTJOIN | Combine text values | Employee and customer details |
| LEFT + RIGHT + MID | Extract text | Employee IDs and invoice numbers |
| TRIM + CLEAN | Clean imported data | Data processing |
| NETWORKDAYS | Calculate working days | HR and operations reporting |
| LET | Simplify complex formulas | Advanced MIS calculations |
Excel compatibility: Some functions, including XLOOKUP, FILTER, UNIQUE, SORTBY, and LET, require Microsoft 365 or supported newer Excel versions, such as Excel 2024. They may not work in Excel 2016 or Excel 2019.
1. XLOOKUP – Find Matching Records Across Worksheets
XLOOKUP is one of the most useful Excel formulas for data operations. It searches for a value in one range and returns corresponding information from another range.
Data operations professionals use XLOOKUP to match employee IDs, customer numbers, invoice details, product codes, and transaction records.
XLOOKUP Formula Syntax
=XLOOKUP(lookup_value,lookup_array,return_array,[if_not_found])
Practical Example
Consider the following employee database.
| Employee ID | Employee Name | Department |
|---|---|---|
| EMP101 | Ravi | Finance |
| EMP102 | Priya | HR |
| EMP103 | Arun | Operations |
| EMP104 | Sneha | IT |
Suppose employee IDs are in A2, employee names in B2, and departments in C2.
To find the department of an employee whose ID is entered in E2, use:
=XLOOKUP(E2,A2:A5,C2:C5,”Not Found”)
If E2 contains EMP103, the result is Operations.
Real Workplace Application
An MIS executive receives an attendance report containing employee IDs but no department information. Instead of manually searching the employee database, XLOOKUP can retrieve department details automatically.
Important Tip: XLOOKUP performs exact matching by default. Check for extra spaces, inconsistent employee IDs, and incorrect data formats when records do not match.
2. INDEX + MATCH – Perform Flexible Data Lookups
The INDEX MATCH formula combines two Excel functions to retrieve information from a dataset.
INDEX returns a value from a specified position, while MATCH identifies the position of a matching record.
INDEX MATCH Formula Syntax
=INDEX(return_range,MATCH(lookup_value,lookup_range,0))
Practical Example
Using the employee database from the previous example:
=INDEX(B2:B5,MATCH(“EMP102”,A2:A5,0))
Result: Priya
MATCH identifies the position of EMP102 in the employee ID column. INDEX returns the corresponding employee name.
Real Workplace Application
INDEX MATCH is useful for employee record matching, inventory reconciliation, financial reporting, and maintaining older Excel workbooks.
XLOOKUP vs INDEX MATCH
| Feature | XLOOKUP | INDEX MATCH |
|---|---|---|
| Ease of use | Generally easier | Requires combined functions |
| Exact matching | Default | Requires MATCH with 0 |
| Lookup direction | Flexible | Flexible |
| Missing value handling | Built-in option | Usually combined with IFERROR |
| Older Excel compatibility | Limited | Better |
| Common use | Modern Excel reports | Legacy and specialized workbooks |
Practical Recommendation: Learn XLOOKUP first if you use modern Excel. Learn INDEX MATCH as well because many organizations still maintain older spreadsheets.
3. SUMIFS – Calculate Totals Using Multiple Conditions
The SUMIFS formula calculates totals based on multiple conditions.
It is widely used in sales reporting, financial operations, branch-wise performance analysis, and monthly MIS reports.
SUMIFS Formula Syntax
=SUMIFS(sum_range,criteria_range1,criteria1,criteria_range2,criteria2)
Practical Example
| Region | Department | Sales Amount |
|---|---|---|
| South | Electronics | ₹45,000 |
| North | Furniture | ₹30,000 |
| South | Electronics | ₹25,000 |
| South | Furniture | ₹15,000 |
| North | Electronics | ₹20,000 |
To calculate total Electronics sales in the South region:
=SUMIFS(C2:C6,A2:A6,”South”,B2:B6,”Electronics”)
Result: ₹70,000
The formula adds ₹45,000 and ₹25,000 because both records satisfy the specified conditions.
Real Workplace Application
A sales operations executive can calculate revenue for a particular region, department, product category, or reporting period.
Common Mistake: The sum range and criteria ranges must have matching dimensions. Incorrect range selection can produce errors or misleading totals.
4. COUNTIFS – Count Records Using Multiple Conditions
COUNTIFS counts records that satisfy specified conditions.
This function is useful for tracking pending tasks, completed cases, employee attendance, customer complaints, and service performance.
COUNTIFS Formula Syntax
=COUNTIFS(criteria_range1,criteria1,criteria_range2,criteria2)
Practical Example
| Employee | Department | Status |
|---|---|---|
| Ravi | Operations | Completed |
| Priya | HR | Pending |
| Arun | Operations | Pending |
| Sneha | Operations | Completed |
| Kiran | Operations | Pending |
To count pending tasks assigned to the Operations department:
=COUNTIFS(B2:B6,”Operations”,C2:C6,”Pending”)
Result: 2
Real Workplace Application
A team leader can calculate the number of pending tasks for each department without manually filtering the entire dataset.
Practical Tip: Use cell references for criteria when creating dashboards. This makes reports easier to update.
5. IF + AND + OR – Apply Business Decision Rules
The IF function, combined with AND or OR, helps automate decisions based on business conditions.
These formulas are commonly used for employee incentives, attendance eligibility, quality checks, and performance classifications.
Practical Example – Employee Incentive Eligibility
Suppose employees qualify for an incentive when monthly sales are at least ₹50,000 and attendance is at least 90%.
=IF(AND(B2>=50000,C2>=90%),”Eligible”,”Not Eligible”)
| Employee | Monthly Sales | Attendance | Result |
|---|---|---|---|
| Ravi | ₹65,000 | 95% | Eligible |
| Priya | ₹48,000 | 92% | Not Eligible |
| Arun | ₹72,000 | 85% | Not Eligible |
The formula returns Eligible only when both conditions are satisfied.
Using the OR Function
=IF(OR(B2>=50000,C2>=90%),”Review”,”Not Qualified”)
This formula returns Review when at least one condition is satisfied.
Also Read: Power BI Interview Questions and Answers Latest Update
Real Workplace Application
HR and operations teams use logical formulas to apply predefined business rules consistently across large datasets.
Important Difference: AND requires all conditions to be true, while OR requires at least one condition to be true.
6. IFERROR – Handle Missing Records and Formula Errors
Excel formulas may return errors such as #N/A, #DIV/0!, or #VALUE! when calculations fail or records cannot be found.
The IFERROR formula replaces an error result with a specified value or message.
IFERROR Formula Syntax
=IFERROR(value,value_if_error)
Practical Example
=IFERROR(B2/C2,0)
If C2 contains zero, the formula returns 0 instead of a division error.
Another example:
=IFERROR(INDEX(B2:B100,MATCH(E2,A2:A100,0)),”Not Found”)
If the employee ID is missing, Excel displays Not Found.
Real Workplace Application
Data operations professionals use IFERROR to make reports easier to read when some records are missing or calculations cannot be completed.
Important Tip: IFERROR does not correct the underlying data problem. In financial reports, displaying zero instead of an error can sometimes hide missing information. Use a message such as “Check Data” when further investigation is necessary.
7. FILTER – Extract Matching Records Automatically
The FILTER function extracts records that satisfy specified conditions.
Unlike manual filtering, FILTER produces a dynamic result that updates when the source data changes.
FILTER Formula Syntax
=FILTER(array,include,[if_empty])
Practical Example
Suppose A2 contains employee names, departments, and task statuses.
To display only pending records:
=FILTER(A2:C100,C2:C100=”Pending”,”No Records”)
The formula returns rows where the task status is Pending.
Real Workplace Application
A data operations executive can create a separate pending-task report that updates automatically when the source data changes.
Common Mistake: FILTER requires sufficient empty cells for its results. If the output area contains existing data, Excel may display a #SPILL! error.
8. UNIQUE – Identify Distinct Values in a Dataset
The UNIQUE function extracts distinct values from a selected range.
It is useful when working with customer lists, employee IDs, product categories, branch names, and transaction records.
UNIQUE Formula Syntax
=UNIQUE(array)
Practical Example
| Customer ID |
|---|
| C101 |
| C102 |
| C101 |
| C103 |
| C102 |
Formula:
=UNIQUE(A2:A6)
Result: C101, C102, C103
To count distinct customer IDs:
=ROWS(UNIQUE(A2:A6))
Result: 3
Real Workplace Application
A customer operations team can identify the number of distinct customers appearing in a transaction dataset.
Identify Duplicate Records
To identify values that appear more than once:
=COUNTIF($A$2:$A$100,A2)>1
The formula returns TRUE when the value appears multiple times.
Important Tip: UNIQUE creates a separate distinct list. It does not remove records from the original dataset.
9. SORT + SORTBY – Organize Data Dynamically
The SORT and SORTBY functions arrange records without changing the original dataset.
SORT organizes a range using a selected column position, while SORTBY sorts records based on another range.
Practical Example
Suppose A2 contains employee names, departments, and monthly sales.
To sort the dataset by the third column in descending order:
=SORT(A2:C10,3,-1)
Alternatively:
=SORTBY(A2:C10,C2:C10,-1)
Both formulas arrange the records so that employees with the highest sales appear first.
Real Workplace Application
These formulas are useful for sales rankings, employee performance reports, inventory analysis, and task prioritization.
Important Tip: Always keep related columns together when sorting records. Sorting only employee names without their corresponding IDs or performance figures can damage data accuracy.
10. SUMPRODUCT – Calculate Weighted and Conditional Results
SUMPRODUCT multiplies corresponding values in arrays and adds the results.
It is useful for inventory valuation, financial calculations, weighted averages, and conditional reporting.
SUMPRODUCT Formula Syntax
=SUMPRODUCT(array1,array2)
Practical Example – Inventory Valuation
| Product | Quantity | Unit Price |
|---|---|---|
| Keyboard | 20 | ₹500 |
| Mouse | 30 | ₹300 |
| Monitor | 10 | ₹6,000 |
Formula:
=SUMPRODUCT(B2:B4,C2:C4)
Calculation:
- Keyboard: 20 × ₹500 = ₹10,000
- Mouse: 30 × ₹300 = ₹9,000
- Monitor: 10 × ₹6,000 = ₹60,000
Total Inventory Value: ₹79,000
Advanced Conditional Example
=SUMPRODUCT((A2:A100=”South”)*(B2:B100=”Completed”)*C2:C100)
This formula totals numeric values in column C for records where the region is South and the status is Completed.
Real Workplace Application
Inventory executives can calculate stock value without creating an additional column for each product’s total value.
Practical Recommendation: Use SUMIFS for straightforward conditional totals. SUMPRODUCT is especially useful when calculations involve multiple arrays.
11. TEXTJOIN – Combine Information From Multiple Cells
The TEXTJOIN formula combines text values using a specified separator.
It is commonly used for preparing employee details, customer information, addresses, and reporting labels.
TEXTJOIN Formula Syntax
=TEXTJOIN(delimiter,ignore_empty,text1,…)
Practical Example
| First Name | Last Name | Department |
|---|---|---|
| Ravi | Kumar | Finance |
Formula:
=TEXTJOIN(” – “,TRUE,A2:C2)
Result: Ravi – Kumar – Finance
Real Workplace Application
A data processing executive can combine employee details into standardized reporting fields.
Important Tip: Keep the original data columns when they are required for future filtering, validation, or analysis.
12. LEFT + RIGHT + MID – Extract Information From Text
Data operations teams frequently receive records containing employee codes, invoice IDs, transaction references, and product numbers.
The LEFT, RIGHT, and MID functions extract specific portions of text.
Practical Example
Suppose cell A2 contains:
EMP-2026-1045
| Function | Formula | Result |
|---|---|---|
| LEFT | =LEFT(A2,3) | EMP |
| RIGHT | =RIGHT(A2,4) | 1045 |
| MID | =MID(A2,5,4) | 2026 |
Real Workplace Application
These functions help extract department codes, year identifiers, invoice references, and product categories from standardized records.
Common Mistake: Fixed-position text extraction works best when all records follow the same format. If identifier lengths vary, TEXTBEFORE and TEXTAFTER may be more appropriate in supported Excel versions.
13. TRIM + CLEAN – Remove Unwanted Spaces and Characters
Poor data quality is a common problem in spreadsheet operations.
Employee names, customer IDs, and product descriptions may contain extra spaces or hidden characters introduced during copying or importing data.
TRIM removes leading and trailing ordinary spaces and reduces repeated spaces between words.
CLEAN removes certain nonprinting characters.
Practical Example
=TRIM(CLEAN(A2))
If A2 contains extra ordinary spaces around Ravi Kumar, the formula returns:
Ravi Kumar
Advanced Data Cleaning Formula
=TRIM(CLEAN(SUBSTITUTE(A2,CHAR(160),” “)))
This formula also handles nonbreaking spaces that may appear in copied web data.
Real Workplace Application
Data operations professionals can clean imported records before performing XLOOKUP, COUNTIFS, or reconciliation tasks.
Important Tip: Clean both datasets before matching records. Removing unwanted spaces from only one file may not solve every lookup problem.
14. NETWORKDAYS – Calculate Working Days Between Dates
The NETWORKDAYS function calculates the number of working days between two dates.
By default, it excludes Saturdays and Sundays. It can also exclude specified holidays.
NETWORKDAYS Formula Syntax
=NETWORKDAYS(start_date,end_date,[holidays])
Practical Example
If A2 contains the start date and B2 contains the completion date:
=NETWORKDAYS(A2,B2)
To exclude holidays listed in E2:E10:
=NETWORKDAYS(A2,B2,$E$2:$E$10)
Real Workplace Application
HR teams use this function for working-day calculations, while operations teams use it to measure turnaround times and service performance.
Important Tip: NETWORKDAYS includes both the start and end dates when they are working days. For organizations with different weekend schedules, NETWORKDAYS.INTL provides additional flexibility.
15. LET – Simplify Complex Excel Formulas
The LET function allows users to assign names to calculations within a formula.
This improves readability and reduces repeated calculations.
LET Formula Syntax
=LET(name1,value1,calculation)
Practical Example – Employee Performance Bonus
Suppose B2 contains monthly sales and C2 contains the sales target.
=LET(sales,B2,target,C2,IF(sales>=target,sales*5%,0))
If monthly sales are ₹80,000 and the target is ₹70,000, the result is:
₹4,000
Real Workplace Application
LET is useful for recurring performance calculations, complex MIS reports, financial models, and spreadsheets that require multiple calculations.
Practical Tip: Use meaningful variable names inside LET formulas so that other employees can understand and maintain the workbook.
Real Data Operations Example – Prepare an Employee Performance Report
Knowing individual Excel formulas is useful, but workplace assignments often require employees to combine multiple functions.
Consider the following sample task-processing report.
| Employee ID | Department | Tasks Completed | Errors | Status |
|---|---|---|---|---|
| EMP101 | Operations | 120 | 2 | Completed |
| EMP102 | Finance | 95 | 5 | Pending |
| EMP103 | Operations | 150 | 1 | Completed |
| EMP104 | HR | 80 | 4 | Pending |
| EMP105 | Operations | 110 | 3 | Completed |
Assume the data is stored in A1.
Task 1 – Count Completed Records
=COUNTIF(E2:E6,”Completed”)
Result: 3
Task 2 – Calculate Tasks Completed by Operations Employees
=SUMIFS(C2:C6,B2:B6,”Operations”)
Result: 380
Task 3 – Find the Department of EMP103
=XLOOKUP(“EMP103″,A2:A6,B2:B6,”Not Found”)
Result: Operations
Task 4 – Calculate Total Errors
=SUM(D2:D6)
Result: 15
Task 5 – Calculate Overall Error Rate
=SUM(D2:D6)/SUM(C2:C6)
Result: Approximately 2.70%
Format the result cell as Percentage.
This calculation assumes that each error is counted against the reported number of completed tasks. Actual workplace quality metrics may use a different denominator.
Original Analysis – Why This Exercise Matters
A data operations report should answer more than one question.
Managers may need to know how many tasks were completed, which departments have pending work, whether error rates are increasing, and which records require investigation.
For example, the sample dataset shows that Operations employees completed 380 tasks, but the report alone does not explain whether that represents good performance. A meaningful evaluation also requires information about assigned workloads, targets, deadlines, and quality standards.
This is an important distinction between performing Excel calculations and interpreting operational data.
Advanced Excel Formulas for Different Job Roles
Different job positions require different combinations of Excel skills.
| Job Role | Important Excel Formulas |
|---|---|
| Data Operations Associate | XLOOKUP, IFERROR, TRIM, COUNTIFS |
| MIS Executive | SUMIFS, COUNTIFS, FILTER, SORTBY |
| Data Analyst | FILTER, UNIQUE, SUMPRODUCT, LET |
| HR Operations Executive | XLOOKUP, IF, NETWORKDAYS |
| Finance Operations Associate | SUMIFS, INDEX MATCH, SUMPRODUCT |
| Back Office Executive | TEXTJOIN, LEFT, RIGHT, IFERROR |
| Inventory Executive | XLOOKUP, SUMPRODUCT, COUNTIFS |
These are practical skill recommendations. Actual job requirements depend on the employer and position.
Important Excel Skills Beyond Formulas
Learning advanced formulas is only one part of becoming proficient in Excel.
Candidates preparing for data operations jobs, MIS executive positions, and Excel-based interviews should also understand the following features.
Also Read: LRS Services Hyderabad Data Entry Opeator Recruitment 2026 :Eiligibility and Full Details
| Excel Skill | Workplace Importance |
|---|---|
| PivotTables | Summarize large datasets |
| Power Query | Import and transform recurring data |
| Conditional Formatting | Highlight errors and exceptions |
| Data Validation | Reduce incorrect data entry |
| Excel Tables | Maintain structured datasets |
| Charts and Dashboards | Present business performance |
| Data Reconciliation | Compare records across files |
| Power Pivot | Work with data models and relationships |
For repeated monthly reporting tasks, Power Query may be more efficient than maintaining hundreds of formulas manually.
Common Excel Mistakes in Data Operations
Incorrect formulas are not the only reason reports fail. Data quality problems can also produce misleading results.
| Common Mistake | Recommended Solution |
|---|---|
| Employee IDs do not match | Check spaces, formats, and leading zeros |
| Formula displays #N/A | Verify lookup values and ranges |
| Formula displays #SPILL! | Clear obstructing cells |
| Incorrect totals | Check conditions and selected ranges |
| Dates appear as text | Convert values into valid Excel dates |
| Formula references change when copied | Use absolute references such as $A$2 |
| Duplicate records affect reports | Validate unique identifiers |
| IFERROR hides missing information | Investigate underlying errors |
| Numbers are stored as text | Convert values to numeric format |
| Source records are outdated | Verify data freshness before reporting |
Practical Insight – A Correct Formula Can Still Produce a Wrong Report
Consider an employee database containing the same employee ID twice.
An XLOOKUP formula may return the first matching record correctly. However, if the first record contains outdated department information, the final report may still be wrong.
The formula is functioning as designed, but the underlying dataset requires validation.
Before preparing important reports, data operations professionals should check for duplicate identifiers, missing records, inconsistent formats, and outdated information.
Advanced Excel Interview Questions and Answers
1. Which Excel formula is best for matching employee IDs?
XLOOKUP is generally a convenient option in modern Excel because it supports exact matching, flexible return columns, and custom messages for missing records. INDEX MATCH is also useful, especially in older workbooks.
2. What is the difference between SUMIF and SUMIFS?
SUMIF calculates totals based on one condition, while SUMIFS supports multiple conditions.
For example, SUMIFS can calculate sales for a particular region and department simultaneously.
3. How can duplicate records be identified in Excel?
COUNTIF can identify repeated values, while Conditional Formatting can highlight duplicates. UNIQUE can generate a separate list of distinct values.
4. Which Excel formulas are useful for MIS reporting?
SUMIFS, COUNTIFS, XLOOKUP, FILTER, SORTBY, and IFERROR are particularly useful for preparing recurring MIS reports.
5. How do you clean imported Excel data?
TRIM, CLEAN, SUBSTITUTE, and suitable text-conversion functions can standardize imported records. Power Query is often better for recurring or large-scale data cleaning.
6. What is the difference between VLOOKUP and XLOOKUP?
VLOOKUP searches the first column of a selected table and returns a value using a column index.
XLOOKUP uses separate lookup and return ranges, making it more flexible and easier to maintain in many situations.
7. Is advanced Excel enough to get a data analyst job?
Advanced Excel provides a useful foundation, but many data analyst positions also require SQL, Power BI, statistics, or other analytical skills.
8. Which Excel formula should freshers learn first?
Freshers can begin with IF, COUNTIF, SUMIF, and basic lookups before moving to XLOOKUP, SUMIFS, COUNTIFS, FILTER, and SUMPRODUCT.
7-Day Advanced Excel Learning Plan
Candidates preparing for Excel-based jobs can follow this practical learning schedule.
| Day | Topics | Practice Task |
|---|---|---|
| Day 1 | XLOOKUP, INDEX MATCH | Match employee records |
| Day 2 | SUMIFS, COUNTIFS | Prepare department-wise reports |
| Day 3 | IF, AND, OR, IFERROR | Build performance rules |
| Day 4 | FILTER, UNIQUE, SORTBY | Create a dynamic report |
| Day 5 | TEXTJOIN, LEFT, RIGHT, MID, TRIM, CLEAN | Clean customer records |
| Day 6 | SUMPRODUCT, NETWORKDAYS, LET | Calculate inventory and turnaround time |
| Day 7 | Revision and mini-project | Prepare an operations MIS dashboard |
Recommended Mini-Project
Create an employee performance workbook containing:
- Employee ID and department information
- Daily task completion records
- Error counts and pending cases
- Department-wise totals
- Employee performance rankings
- A separate report showing pending records
- Basic data-quality checks
Use XLOOKUP to retrieve employee information, SUMIFS for totals, COUNTIFS for pending cases, and FILTER to create a separate report.
A completed mini-project can provide practical evidence of Excel skills during job interviews.
Excel Skills for Freshers – What to Learn First
Fresh graduates do not need to master every advanced Excel function immediately.
A more practical learning order is:
Beginner Level: SUM, AVERAGE, COUNT, IF, COUNTIF, and basic data formatting.
Intermediate Level: XLOOKUP, INDEX MATCH, SUMIFS, COUNTIFS, IFERROR, and conditional formatting.
Advanced Level: FILTER, UNIQUE, SORTBY, SUMPRODUCT, LET, Power Query, and dashboard preparation.
Candidates applying for data operations positions should focus on accuracy, data cleaning, reporting, and problem-solving rather than memorizing formula names alone.
Official Microsoft Excel Learning Resources
Microsoft provides official documentation explaining Excel functions, syntax, and supported versions.
| Resource | Official Website |
|---|---|
| Microsoft Excel Help | Check Now |
| XLOOKUP Function | Microsoft Xlookup Function |
| FILTER Function | Check Now |
| Excel Training and Support | https://support.microsoft.com/en-us/excel |
Candidates should check the documentation for compatibility and additional examples when using different Excel versions.
Conclusion
Learning the top 15 advanced Excel formulas used in data operations can improve the accuracy, speed, and consistency of everyday reporting tasks.
For beginners, XLOOKUP, SUMIFS, COUNTIFS, IFERROR, and TRIM are particularly useful starting points because they address common workplace problems involving record matching, conditional calculations, task tracking, and data cleaning.
After gaining confidence with these functions, candidates can learn FILTER, UNIQUE, SORTBY, SUMPRODUCT, and LET to prepare more flexible reports.
However, Excel proficiency is not measured by the number of formulas someone remembers. Employers also value the ability to verify information, identify errors, explain results, and prepare reports that others can understand.
The best way to improve is to practise with realistic datasets, check the results carefully, and build small reporting projects that demonstrate practical problem-solving skills.